Shib Coin On-Chain Activity and Technical Outlook: New Insights into Whales and Trading Volume
8/4/2025, 5:02:22 AM
Overview of today’s price and Trading Volume
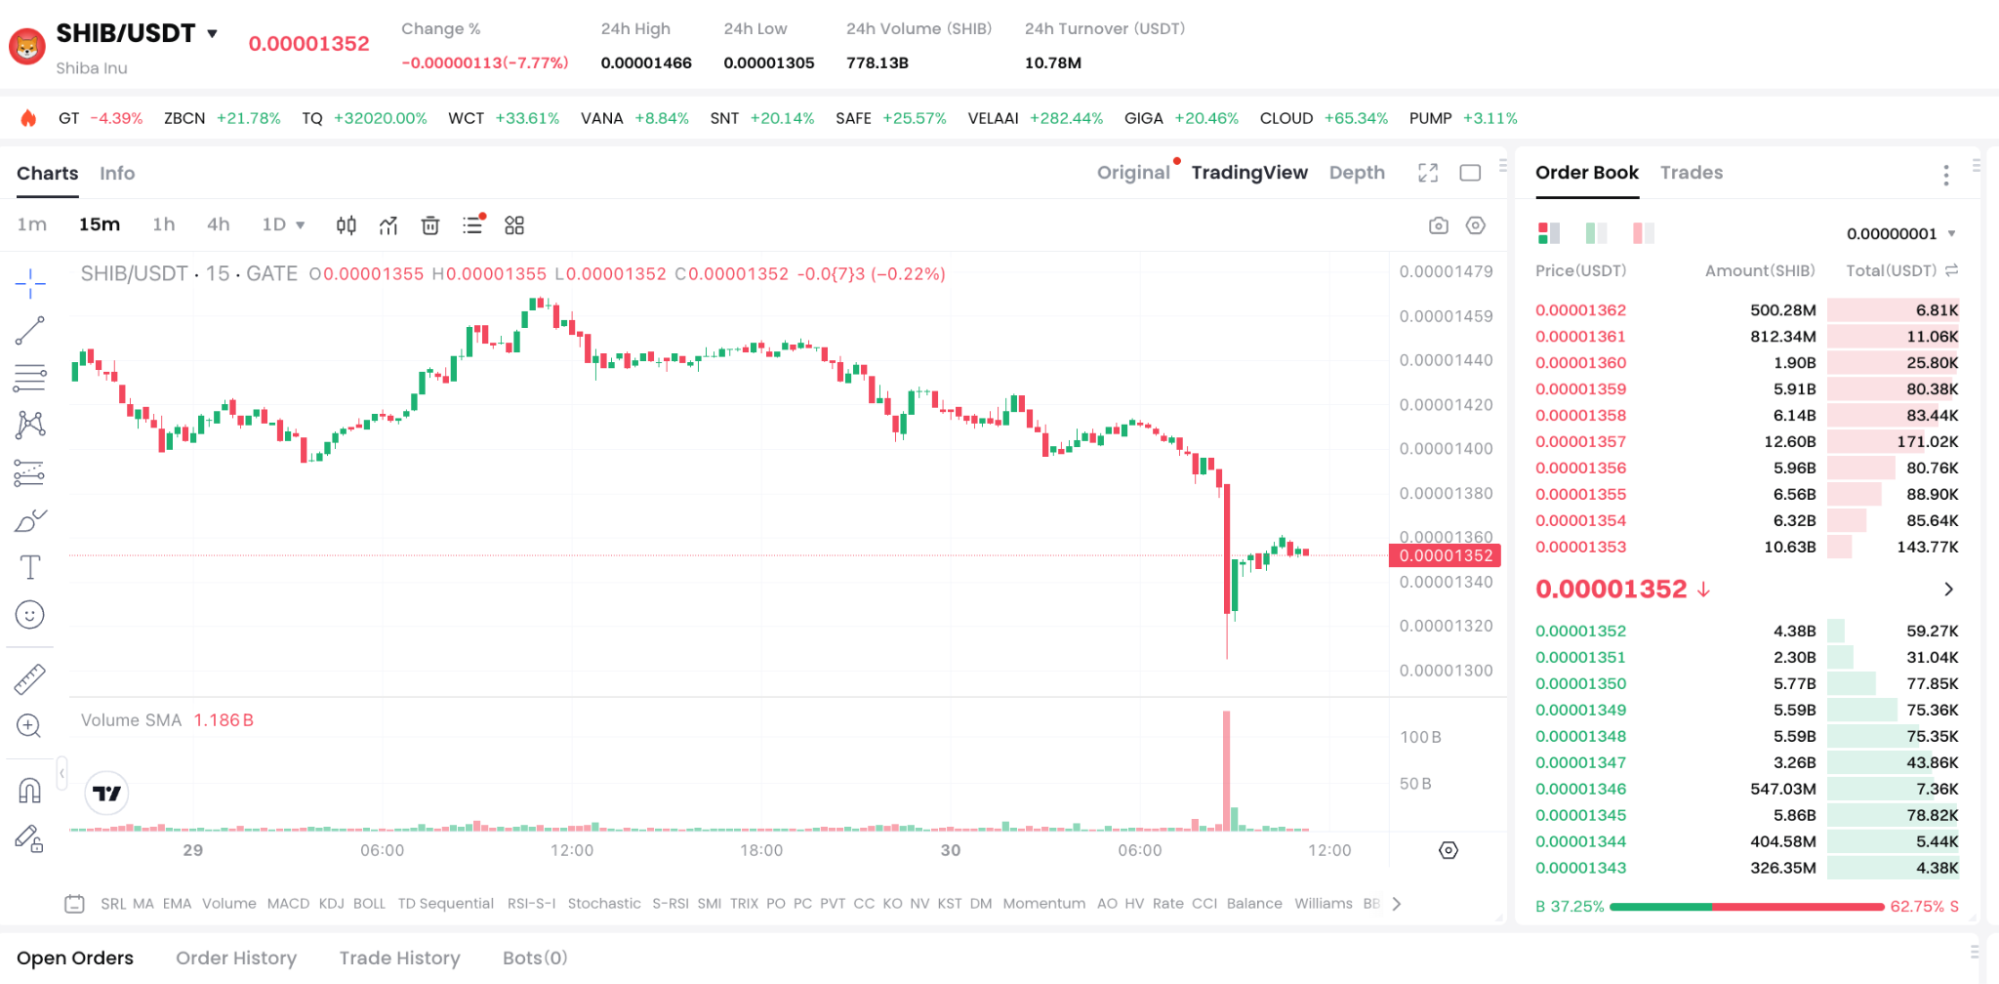
Figure:https://www.gate.com/trade/SHIB_USDT
- Price: $0.00001351 (Gate)
- 24h Trading Volume: Approximately 78.59 billion SHIB ($10.9M USDT), an increase of 18% compared to the previous period.
- Trading range: highest $0.00001369, lowest $0.00001305
Whale Positions and Large Transaction Changes
- In the past 24 hours, the Whale addresses’ holdings rebounded from 727.8 trillion SHIB to 749.6 trillion, an increase of about 3%.
- The number of large transactions (>10B SHIB) has slightly increased, indicating that some whales are accumulating at low levels.
- At the same time, the large sell-off volume has not shown a large-scale outbreak, which helps stabilize in the short term.
Technical Formation: Rebound Signal and Downward Channel
- The daily chart is still operating within a descending channel, but today it formed a bullish candlestick with a long lower shadow, suggesting that bulls are attempting to defend the market.
- The KDJ indicator is about to golden cross, indicating a potential technical rebound of 2%–4%.
- Be cautious if the lower channel support at $0.00001330 is not maintained, as it will restart a new round of downward exploration.
Key Ranges: Support and Resistance
- Support: $0.00001330 — lower channel boundary and previous low position
- Resistance: $0.00001370 — Short-term consolidation high and 50-day moving average
Investor Operation Recommendations
- Cautious observation, waiting for rebound confirmation: If the closing remains above $0.00001350, consider a small position entry.
- Reasonable Stop Loss: Stop loss and exit if it falls below $0.00001330 to prevent downward break risk.
- On-chain tracking tools: Use Santiment and Glassnode to monitor whale addresses and large transactions in real time.
- Monitor market sentiment: Adjust positions based on the Fear & Greed Index and social media dynamics.
* The information is not intended to be and does not constitute financial advice or any other recommendation of any sort offered or endorsed by Gate.
Start Now
Sign up and get a
$100
Voucher!